Slider Data Visualisation BGtitleTranforming Studies & Scientific Data into impressive & understandable Visual Stories

Do the following situations seem familiar to you?

The trial results for your product are excellent. They are, however, also extremely comprehensive, full of data and difficult to understand. Your PowerPoint slide deck is packed with too much information, it is hard to follow the central idea of the graphics that have come from a variety of sources. Your target group does not really understand the crucial scientific material relating to your product.


That's a lot of science

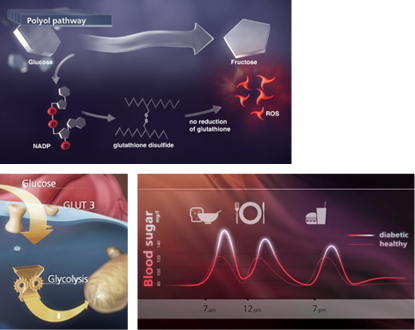
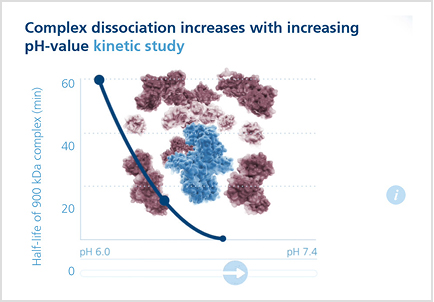
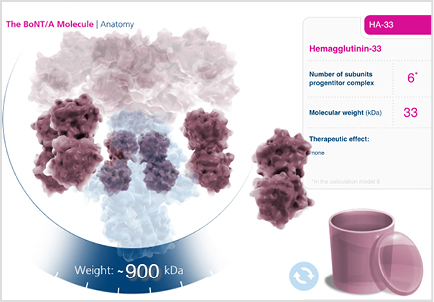
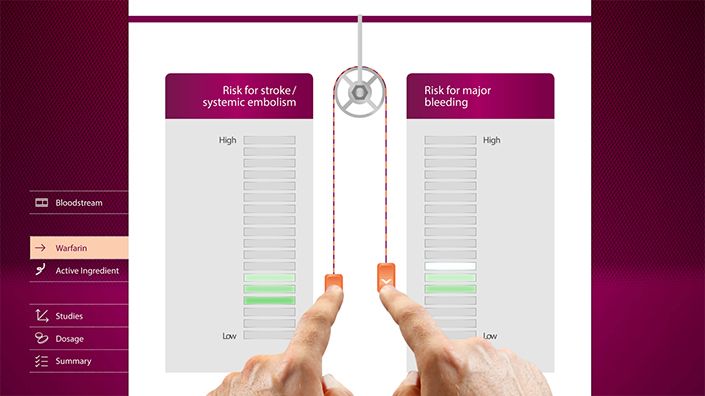
With the help of Visual Storytelling, scientific studies,
data and processes can be simplified and explained more clearly.

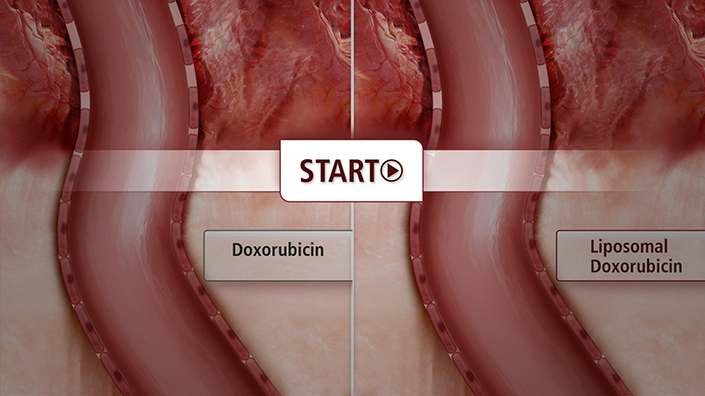
To implement your Visual Story, a variety of stylistic means are available, such as 3D animations, 2D infographics or sketched illustrations. The final media can be animated films, interactive applications, iPad applications, slide decks or PowerPoint presentations with high-quality animations.

Examples and Costs

The costs for implementing a Visual Story naturally depend on various factors, including whether existing content should only be improved visually, or whether the intention is to develop a completely new didactic and visual approach.

BEFORE

AFTER

Improving existing content

Existing content is adapted to fit design, usability concept and navigation; the content itself will remain almost the same.

Elaborating on existing content

Existing content is developed further, visually improved so it is easier to understand and, if applicable, an interactive or animated component will be added.

BEFORE

After: Line chart

AFTER

BEFORE

AFTER

New visual approach

For existing content, a completely new, visually more understandable approach is developed and, if applicable, implemented using interactive or animated components.

Featured Case Studies

Want to target your audience?

Visual Storytelling for study results – the best way to visualize data

In order to feel confident recommending and prescribing your product, HCPs need to understand and be convinced by your product‘s mode of action, clinical data, and studies. The best way to gain their confidence? Through a vivid and conclusive story which utilizes clear and appealing data visualization and memorable images.

With the help of Visual Storytelling, facts and figures, processes, and technologies can be simplified and explained more clearly.

Infographics or engaging slide decks rapidly and precisely convey content.

As an experienced data visualization company, CAST PHARMA’s team of experts in medical visualization have an established workflow which guarantees that your complex story will be brought to life in a way that is informative yet easy-to-understand, scientifically correct but visually appealing, and of high quality while still cost effective.

You might also be interested in…

Though traditional text-heavy learning tools are easier to produce, numerous studies have shown that the best learning results generally come from combinations of text, images, and – best of all – interaction.

Learn more…

Your various target groups, such as healthcare professionals, patients, investors and shareholders demand tailor-made information about product benefits. Most importantly, scientific and product-related facts such as the underlying mechanism of action have to be communicated effectively, within the industry and beyond.

Learn more…

Explaining the mechanism of a disease (MoD) or the disease pathophysiology in a clear and concise way is crucial to help healthcare professionals, patients, investors, and other target groups fully understand a disease.

Learn more…

You have a promising investigational compound to address an unmet medical need. However, there are many hurdles on the way to a successful product, and it is often necessary to convince others of your compound‘s potential. Above all, results need to be communicated to various target groups.

Learn more…