Bringing scientific study data to life with animation
Academic publications present scientific studies and clinical trials in a text-heavy format. That means several pages of black print on white paper. Multi-clause sentences often more than 5 lines long, loaded with uncommon abbreviations. And an incredible amount of data in long, grey tables or confusing diagrams plotting several curves.
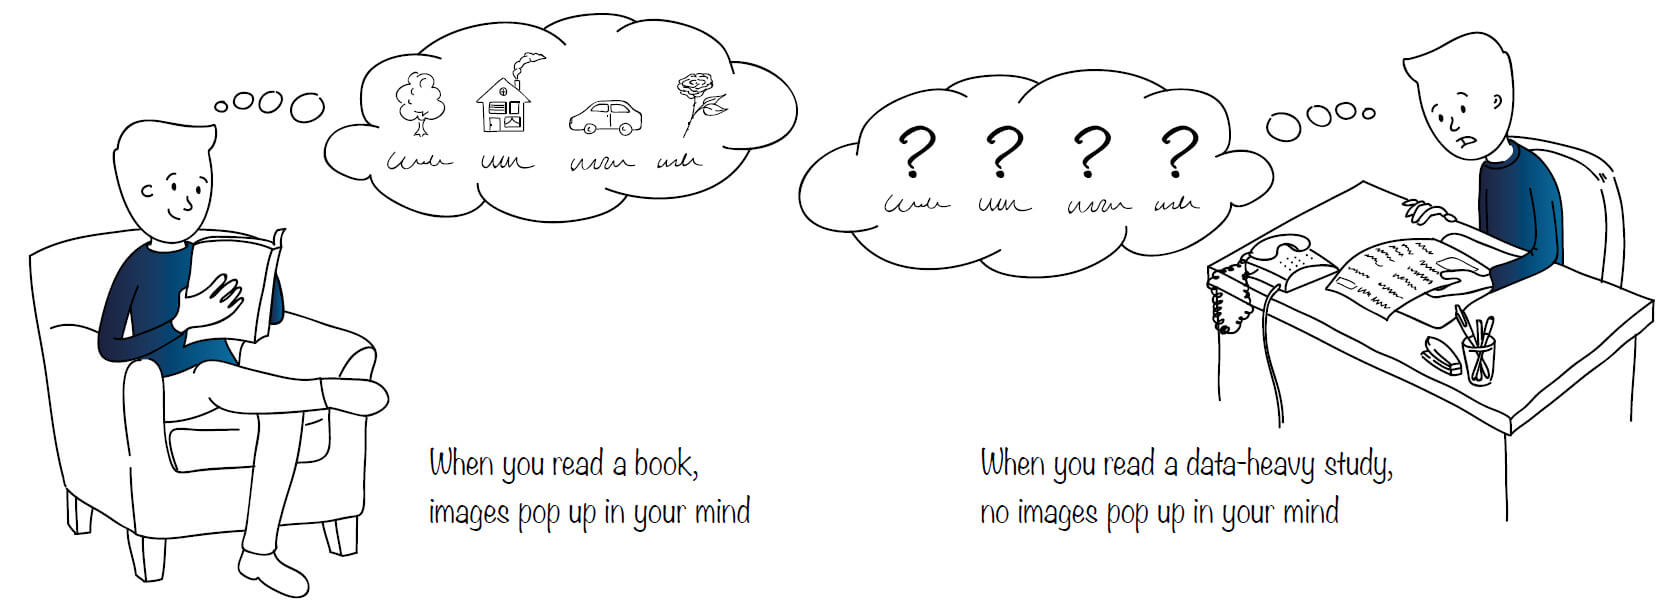
No wonder your colleagues don’t share your enthusiasm about your pivotal phase III 12-week, randomized, double-blind, placebo controlled, multi-center, parallel group clinical trial. They can’t understand it. For many people, reading text-heavy articles that contain static tables and diagrams isn’t just dull and time-consuming—it’s also not an effective strategy for learning new information.
Multimedia offers a more promising approach. Psychology professor and writer Allan Paivio hypothesized that visual input and verbal input are processed differently in the human mind and the information learned is then organized using mental codes corresponding to these separate representations. Because multimedia and interactive tools engage both spatial and verbal memory, the information they present is dually coded – in a way, doubly learned – and is so more likely to stick in the user’s memory.
Turning your study into a powerful story
A powerful, multimedia tool to elicit excitement and enthusiasm for communicating study results is an animated video.
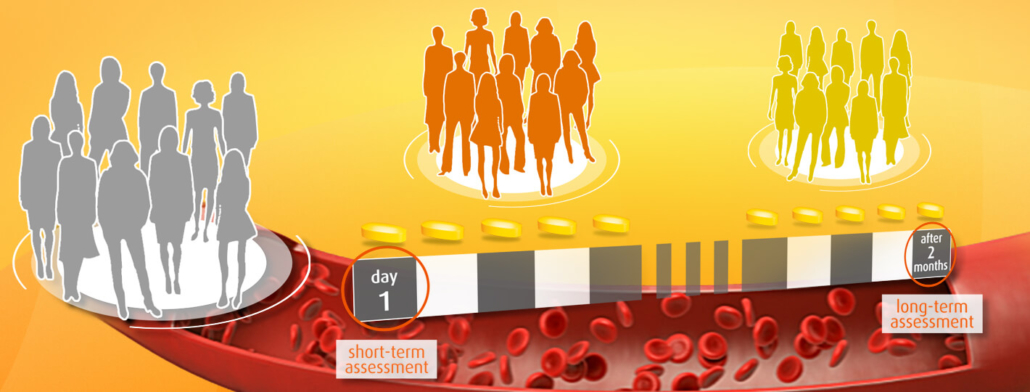
Animation catches the attention of the audience. No need to dig through a publication to understand the trial design. Study populations can be shown as groups of silhouettes. A treatment procedure is no longer a list of words. It becomes an animated timeline. And analytical methods like an MRI assessment can be transformed from abstractions into a virtual investigation of a study participant.
Using the syntax of cutting, perspective, and movement, animation will also help to guide the viewer through a logical sequence of information.
A voice-over can provide your audience with information supporting the animation. The content and speed of an effective voice-over are designed for a listener, and the animation and audio should complement each other. So while the animation establishes the study design, the speaker can describe the study populations or the treatment regimen.
The problem with the length
A video covering study data should typically range between two and four minutes. Any longer and you risk losing your viewer’s attention. To make your story concise and easily accessible, it is necessary to first outline any information that must be included for the audience to understand the results of the trial. They should not be led astray by over-generalizations, but neither should they be so burdened with details that they lose the key message. Remember, the goal is to impart a nuanced yet clear key message, and to this end what you do include in a video is as important as what you don’t.
Different graphical approaches for different audiences
Different animation styles can be used in order to reach out to a specific target audience. You could use 2D sketches for patient-related trial information, explanatory infographics for a conference audience, or sophisticated, highly-detailed 3D animation to explain your trial outcome and its significance to clinicians and KOL’s.
Do you have any questions about 3D animation or would you like to see some more examples of 3D animation that pays off?
If you work in pharma or biotech, and you’re looking to use 3D animation to support your communication objectives, we would love to hear from you. Whether you have a specific project in mind or you’re just looking for guidance, click below to get in touch and learn how the power of visual storytelling can work for you.